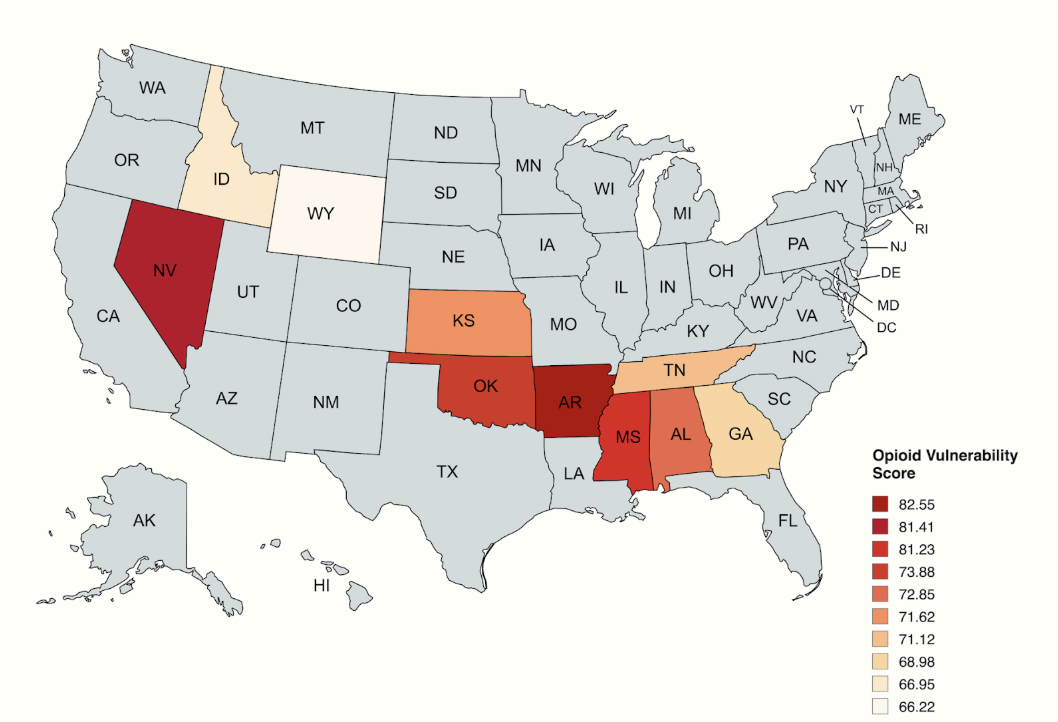
America’s Most Opioid-Vulnerable States 2025
FirePit Health's Opioid Vulnerability Index shines a light on how states are responding to America's ongoing addiction crisis. In this comprehensive analysis, we examine which communities face the highest risk of opioid-related harm and where prevention efforts are falling short.
Key Findings at a Glance
- Risk isn’t limited to overdose deaths – Many high-ranking states show persistent medical, economic, and treatment access gaps despite declining overdose rates nationwide.
- Arkansas, Nevada, and Mississippi lead in vulnerability – Each shows a dangerous mix of high opioid prescribing, chronic pain, and limited clinic access.
- Clinic access varies dramatically – In rural Nevada and Wyoming, low clinic density leaves vast regions without timely treatment options.
- Economic and insurance barriers worsen the crisis – States with higher uninsured rates, like Oklahoma and Georgia, face greater challenges in connecting people to care.
- High prescribing persists in some states – Arkansas and Alabama both maintain opioid dispensing rates above 70 per 100 people, the highest in the nation.
- Pain prevalence drives demand – Self-reported chronic pain levels in top states reach as high as 23.4%, often with few safe, affordable alternatives available.
- Declining overdoses don’t tell the whole story – Vulnerability indicators show that many at-risk communities remain underserved and at risk of future surges.
Every American community deserves access to comprehensive prevention and treatment resources. But as state responses vary dramatically, millions of families remain trapped in cycles of pain, addiction, and limited care options. The impact of this inaction doesn't fall equally on all communities; these policy gaps deepen health disparities across state lines, particularly affecting rural, low-income, and underinsured populations.
See where your state falls in our vulnerability rankings, and then learn what policies can help build stronger communities that catch people before they fall into crisis.
Explore our complete state rankings and methodology in the full 2025 report below.
To rank all 50 states by opioid vulnerability, FirePit Health analyzed five equally weighted risk factors that research links to opioid-related harm: opioid dispensing rates, self-reported chronic pain prevalence, access to Medication-Assisted Treatment (MAT) clinics, unemployment rates, and uninsured rates.
Data was drawn from the CDC, SAMHSA, NIH, Bureau of Labor Statistics, and U.S. Census Bureau, with each measure standardized and combined into a single Opioid Vulnerability Score. Higher scores indicate greater combined risk from medical, economic, and treatment access gaps.
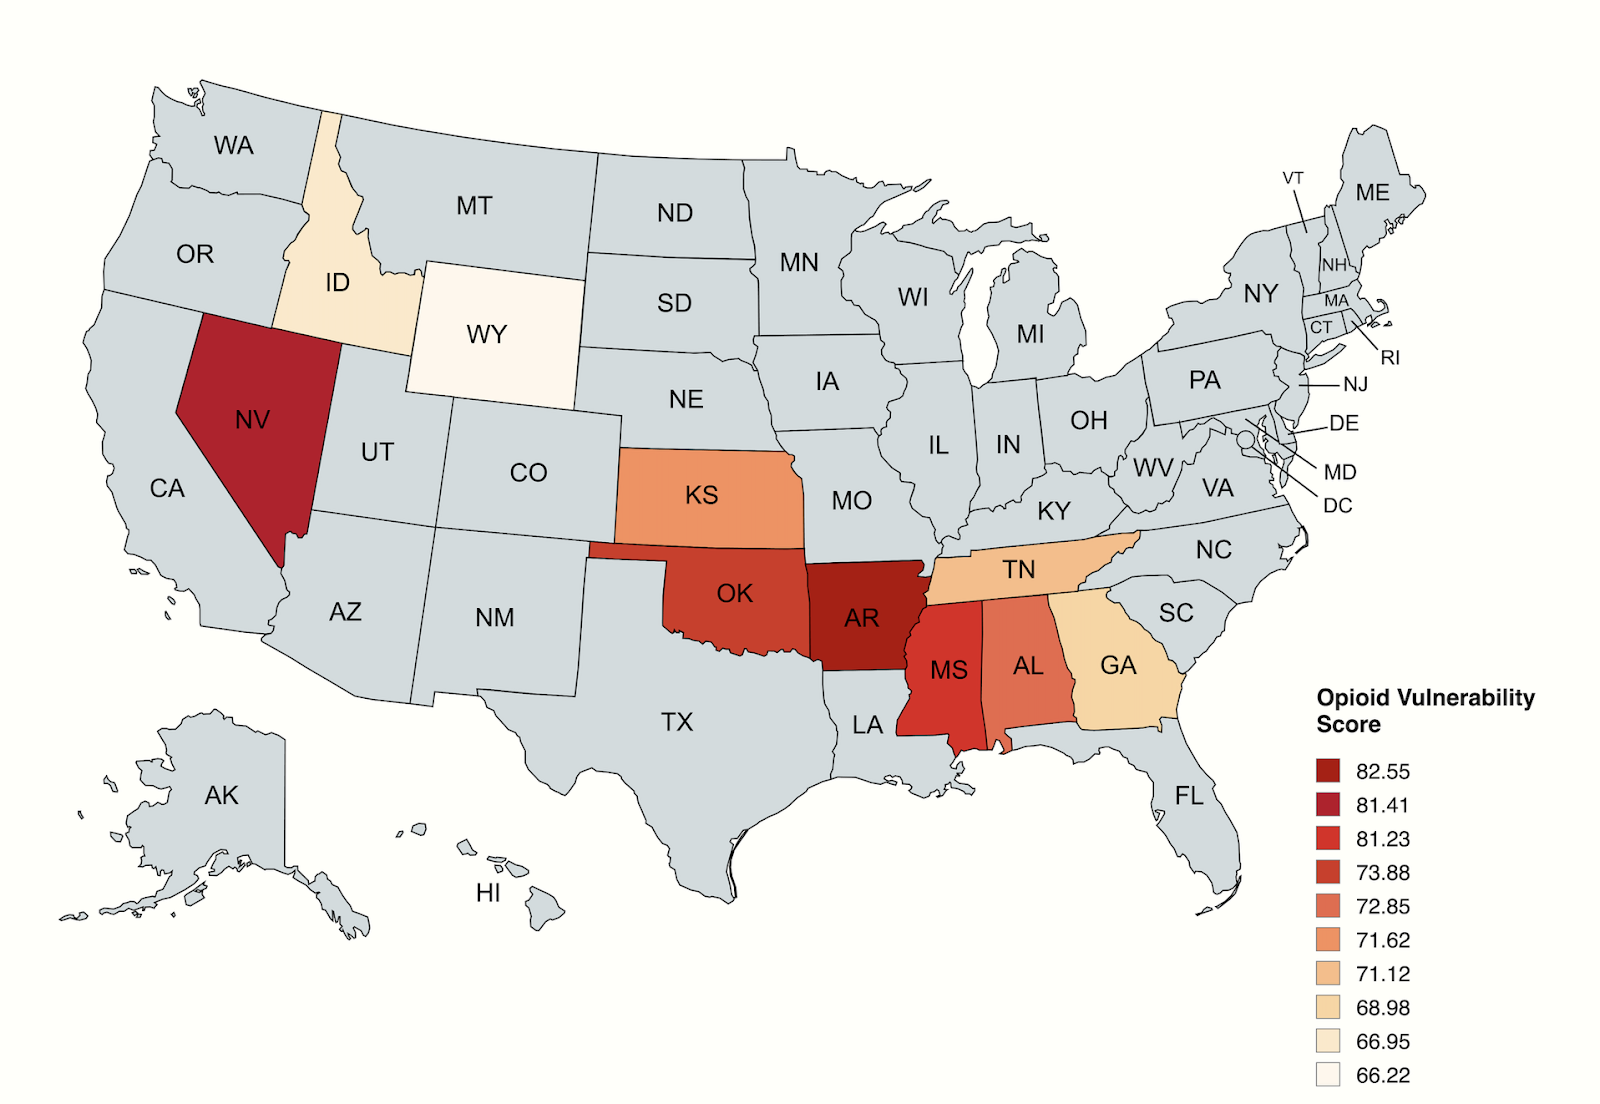
The Top 10 Most Vulnerable States
Understanding the Crisis Hotspots
Arkansas – America’s Highest Risk State (Score: 82.55)
Arkansas faces the most severe opioid vulnerability in the nation, driven by a dangerous combination of factors:
- Highest prescription rate nationally: 71.5 opioids dispensed per 100 people
- Highest chronic pain burden: 23.4% of adults report chronic pain
- Limited rural access: Despite 21 certified treatment programs, clinic density of only 18.8 per 10,000 sq km leaves rural communities underserved
- Insurance gaps: 8.9% uninsured rate compounds access barriers
The state’s rural geography and economic challenges create a perfect storm where high pain levels meet limited alternatives to prescription opioids.
Nevada – The Access Desert (Score: 81.41)
Nevada’s second-place ranking reflects severe treatment access challenges:
- Lowest treatment density: Only 7.4 MAT clinics per 10,000 sq km, primarily concentrated in Clark and Washoe counties
- Economic instability: 5.1% unemployment rate, highest among top 10 states
- Insurance coverage gaps: 10.8% uninsured rate limits treatment options
- Geographic barriers: Vast rural areas with minimal healthcare infrastructure
Most of Nevada’s 15 certified opioid treatment programs cluster in urban areas, leaving rural populations hours from help.
Mississippi – The Southern Challenge (Score: 81.23)
Mississippi’s vulnerability stems from multiple systemic challenges:
- High prescription rates: 63.1 per 100 people, indicating widespread opioid exposure
- Chronic pain burden: 16.4% report ongoing pain issues
- Healthcare access: Despite 17.5 clinic density, many regions remain underserved
- Insurance barriers: 10.3% uninsured rate limits treatment accessibility
The state has at least 10 methadone clinics in cities like Jackson, Biloxi, and Meridian, but rural access remains problematic.
Oklahoma – The Prescribing Problem (Score: 73.88)
Oklahoma’s fourth-place ranking reflects high opioid use and persistent care gaps:
- High prescription rates: 52.9 per 100 people, above the national average
- Pain prevalence: 13.2% of adults report chronic pain
- Treatment density mismatch: 19.5 clinics per 10,000 sq km, but access remains uneven across rural counties
- Insurance challenges: 11.4% uninsured rate—the highest among top 5 states
While Oklahoma has a relatively strong number of clinics on paper, they are unevenly distributed, making treatment harder to reach in underserved areas.
Alabama – High Exposure, Uneven Access (Score: 72.85)
Alabama’s fifth-place ranking highlights the dangers of high opioid prescribing and coverage gaps:
- Extremely high prescription rate: 71.4 per 100 people, second only to Arkansas
- Chronic pain burden: 16.9% of adults affected
- Strong clinic density: 24.3 per 10,000 sq km, but rural populations still face barriers
- Coverage gaps: 8.5% uninsured rate hinders access to care
Alabama’s high prescribing culture, combined with a sizeable uninsured population, keeps opioid harm risk high even where treatment resources exist.
"Our study shows that behind every vulnerability ranking is a person who didn't get the help they needed,” says Dr. Hamilton Gaiani, MD, Chief Medical Officer at FirePit Health. “These aren't just numbers; they reflect missed chances for care, connection, and healing. We can't afford to treat opioid risk like background noise. It's time to listen closer, act sooner, and build systems that catch people before they fall."
More Addictions